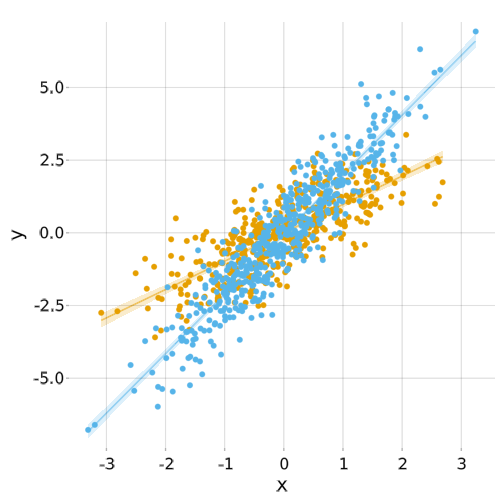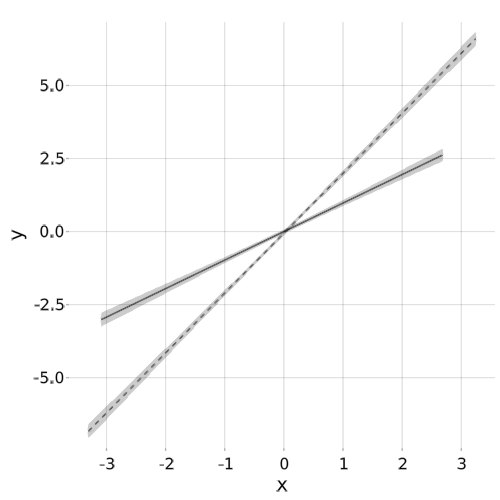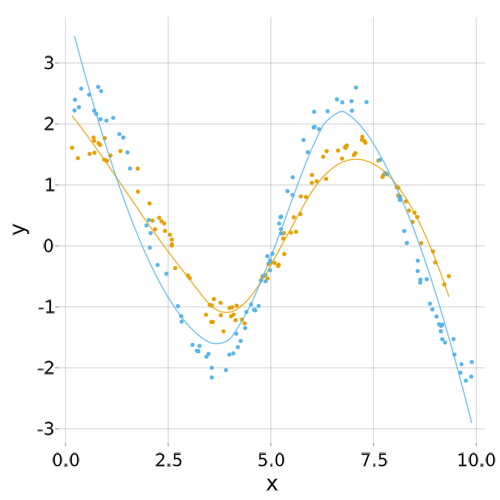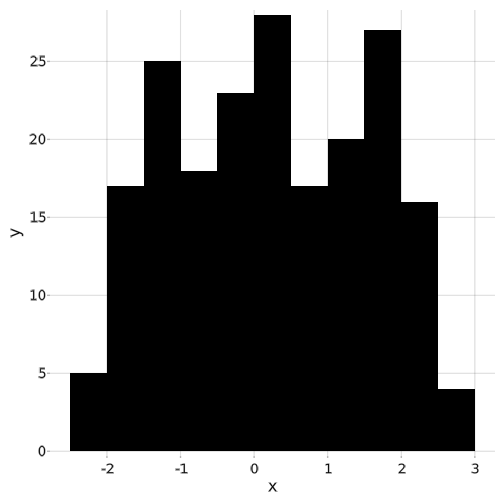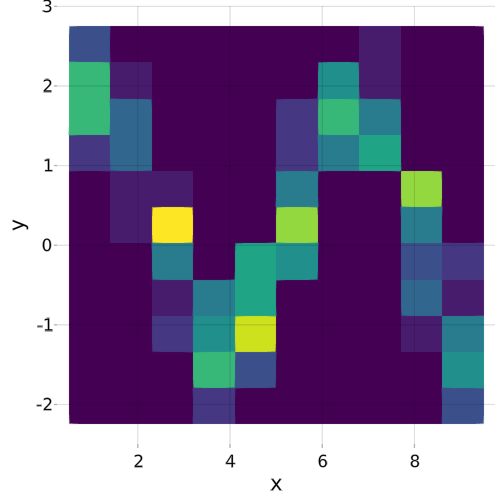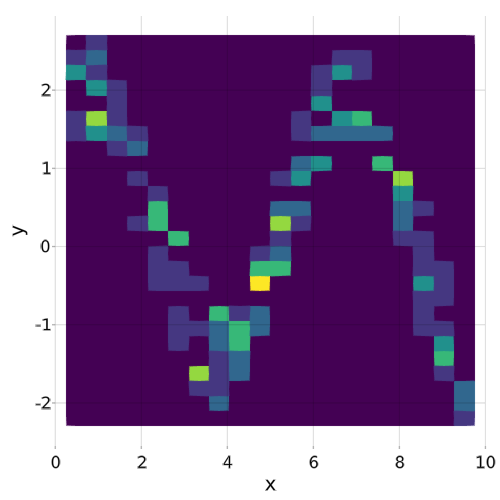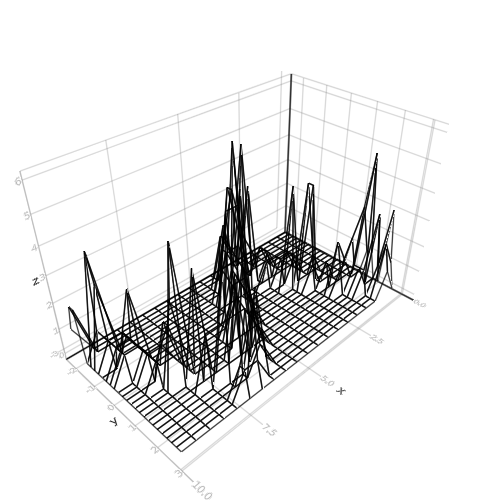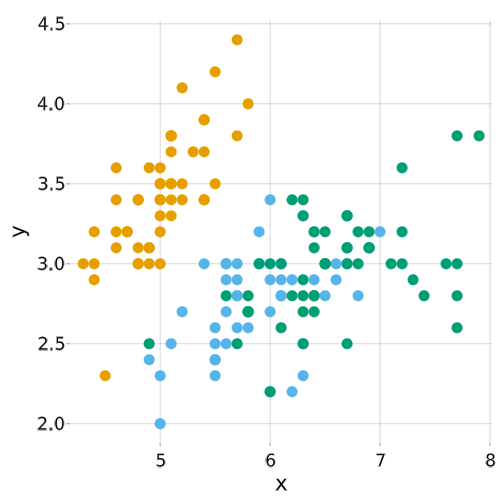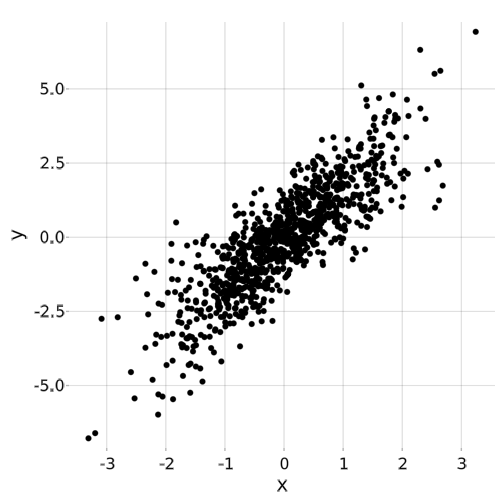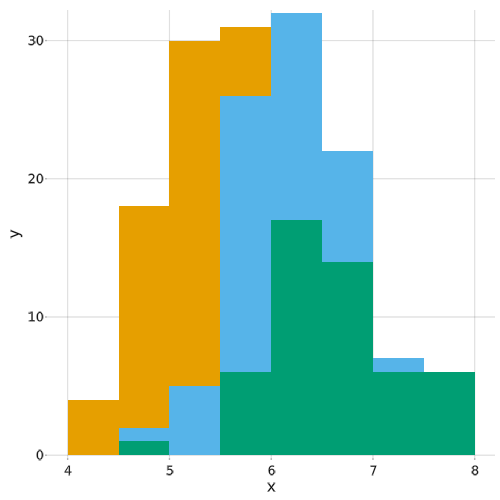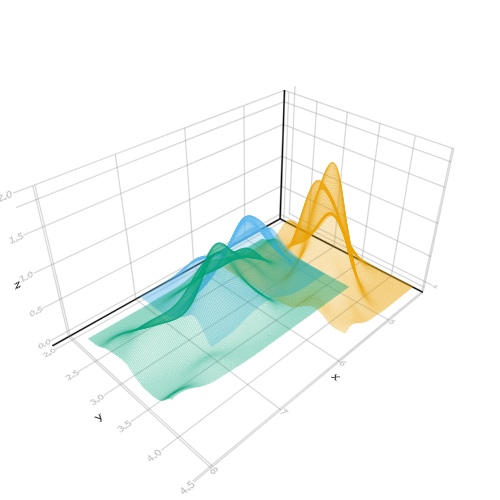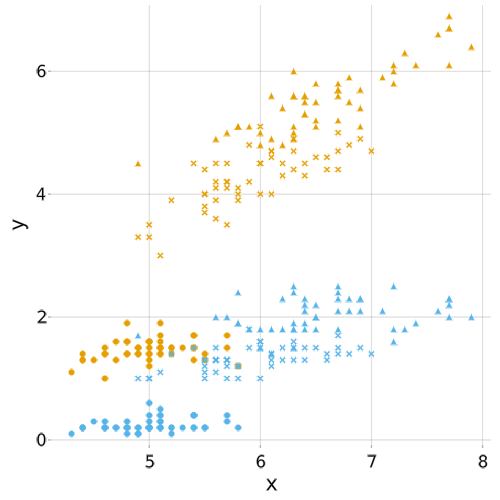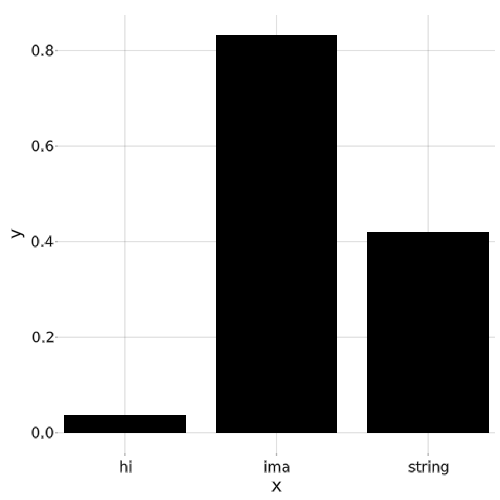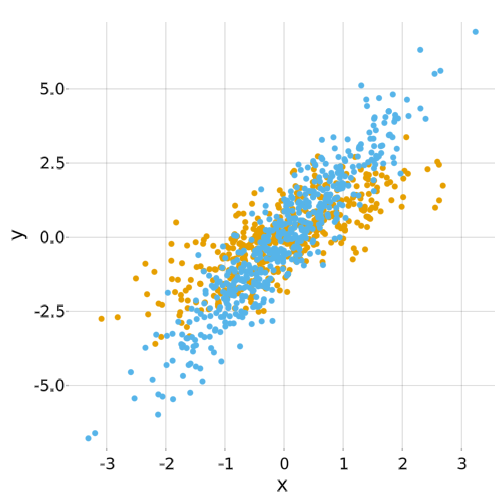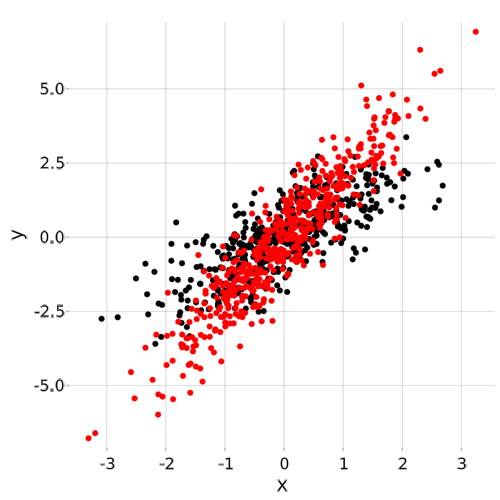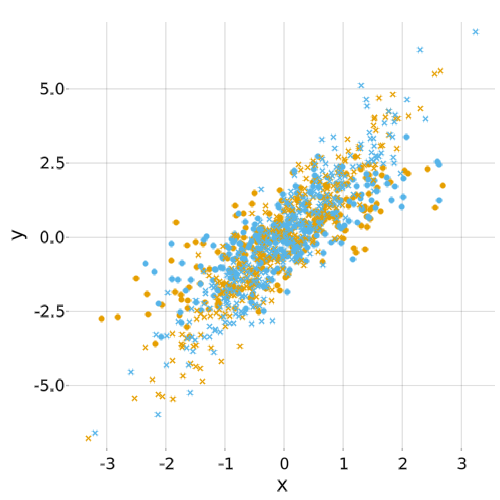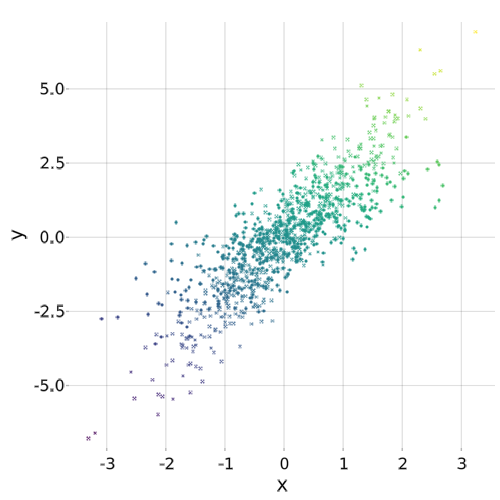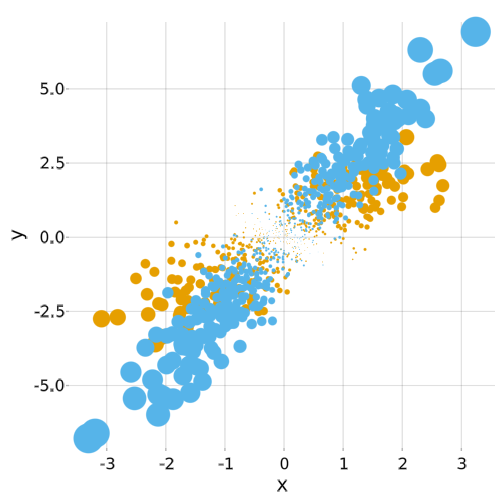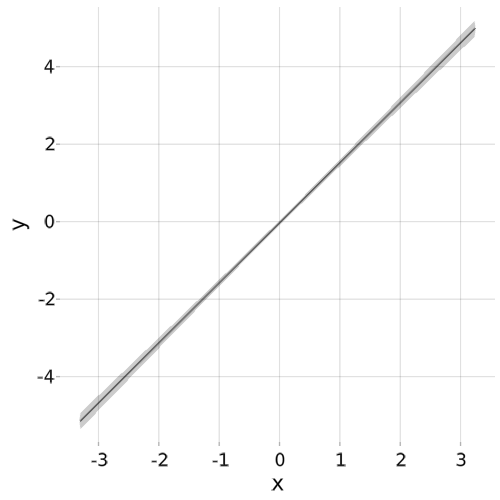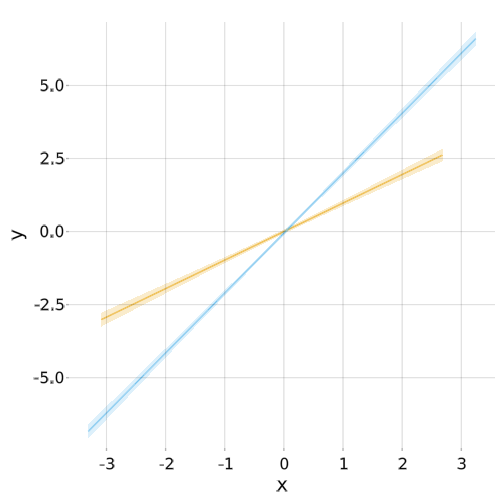
using StatsMakie
using DataFrames, RDatasets
using StatsMakie: linear, smooth

using AbstractPlotting

N = 1000
a = rand(1:2, N) # a discrete variable
b = rand(1:2, N) # a discrete variable
x = randn(N) # a continuous variable
y = @. x * a + 0.8*randn() # a continuous variable
z = x .+ y # a continuous variable
@substep

scatter(x, y, markersize = 0.2)
@substep

scatter(Group(a), x, y, markersize = 0.2)
@substep

scatter(Group(a), x, y, color = [:black, :red], markersize = 0.2)
@substep

scatter(Group(marker = a), x, y, markersize = 0.2)
@substep

scatter(Group(marker = a, color = b), x, y, markersize = 0.2)
@substep

scatter(Group(marker = a), Style(color = z), x, y)
@substep

scatter(Group(color = a), x, y, Style(markersize = z ./ 10))
@substep

plot(linear, x, y)
@substep

plot(linear, Group(a), x, y)
@substep

scatter(Group(a), x, y, markersize = 0.2)
plot!(linear, Group(a), x, y)
@substep

plot(linear, Group(linestyle = a), x, y)
@substep

N = 200
x = 10 .* rand(N)
a = rand(1:2, N)
y = sin.(x) .+ 0.5 .* rand(N) .+ cos.(x) .* a
@substep

scatter(Group(a), x, y)
plot!(smooth, Group(a), x, y)
@substep

plot(histogram, y)
@substep

plot(histogram, x, y)
@substep

plot(histogram(nbins = 30), x, y)
@substep

wireframe(histogram(nbins = 30), x, y)
@substep

iris = RDatasets.dataset("datasets", "iris")
scatter(Data(iris), Group(:Species), :SepalLength, :SepalWidth)
@substep
# use Position.stack to signal that you want bars stacked vertically rather than superimposed
plot(Position.stack, histogram, Data(iris), Group(:Species), :SepalLength)
@substep

wireframe(
    density(trim=true),
    Data(iris), Group(:Species), :SepalLength, :SepalWidth,
    transparency = true, linewidth = 0.1
)
@substep

scatter(
    Data(iris),
    Group(marker = :Species, color = bycolumn),
    :SepalLength, (:PetalLength, :PetalWidth)
)
@substep

barplot(["hi", "ima", "string"], rand(3))
@substep