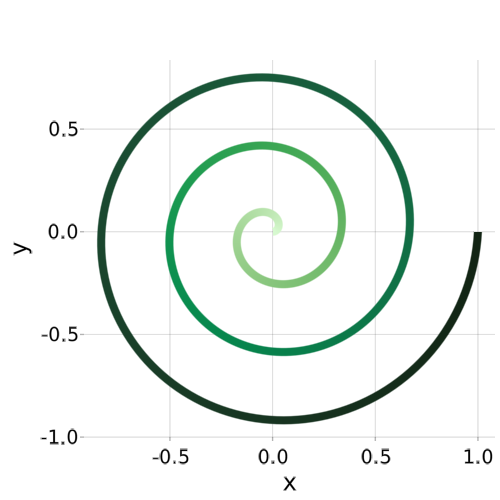
using AbstractPlotting

t = range(0, stop=1, length=500) # time steps
θ = (6π) .* t    # angles
x = t .* cos.(θ) # x coords of spiral
y = t .* sin.(θ) # y coords of spiral
p1 = lines(
     x,
     y,
     color      = t,
     colormap   = :algae,
     linewidth  = 8,
     scale_plot = false
 )