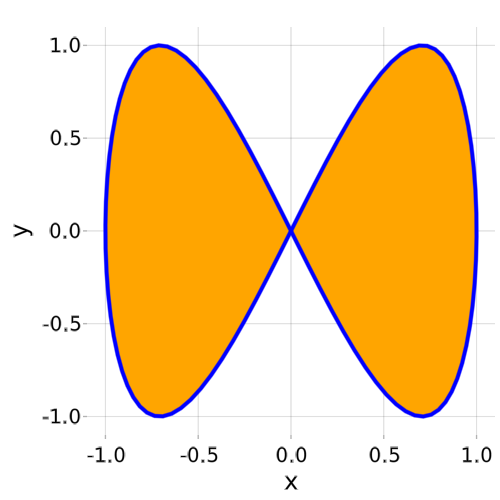
using AbstractPlotting

x = LinRange(0, 2pi, 100)
poly(Point2f0.(sin.(x), sin.(2x)), color = "orange", strokecolor = "blue", strokewidth = 4)