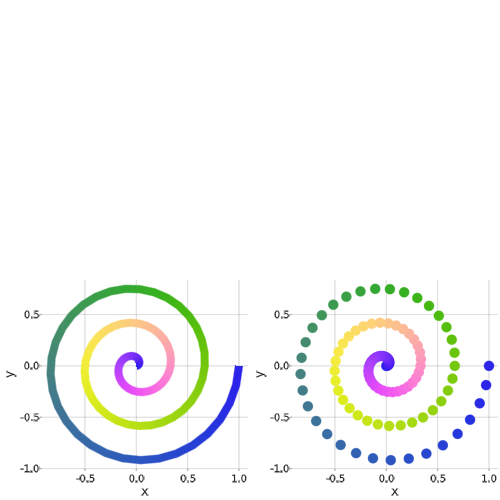
using AbstractPlotting

t = range(0, stop=1, length=100)
θ = (6π) .* t
x = t .* cos.(θ)
y = t .* sin.(θ)
p1 = lines(x,y,color=t,colormap=:colorwheel,linewidth= 8,scale_plot= false)
p2 = scatter(x,y,color=t,colormap=:colorwheel,linewidth= 8,scale_plot= false)
vbox(p1, p2)