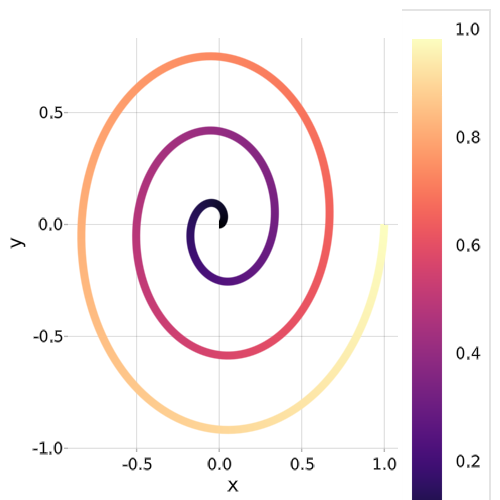
using ColorSchemes      # colormaps galore

using AbstractPlotting


t = range(0, stop=1, length=500) # time steps

θ = (6π) .* t    # angles

x = t .* cos.(θ) # x coords of spiral
y = t .* sin.(θ) # y coords of spiral

p1 = lines(
    x,
    y,
    color = t,
    colormap = ColorSchemes.magma.colors,
    linewidth=8)

cm = colorlegend(
    p1[end],             # access the plot of Scene p1
    raw = true,          # without axes or grid
    camera = campixel!,  # gives a concrete bounding box in pixels
                         # so that the `vbox` gives you the right size
    width = (            # make the colorlegend longer so it looks nicer
        30,              # the width
        540              # the height
    )
    )

scene_final = vbox(p1, cm) # put the colorlegend and the plot together in a `vbox`