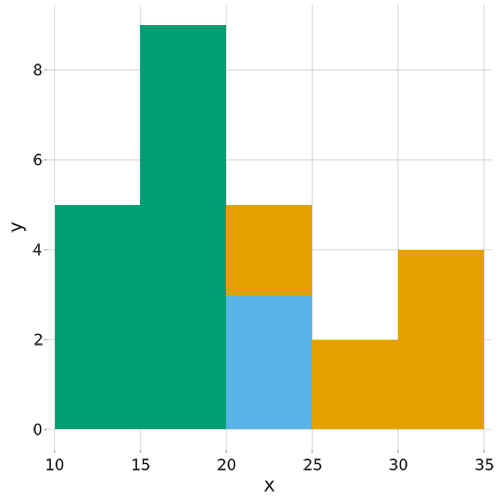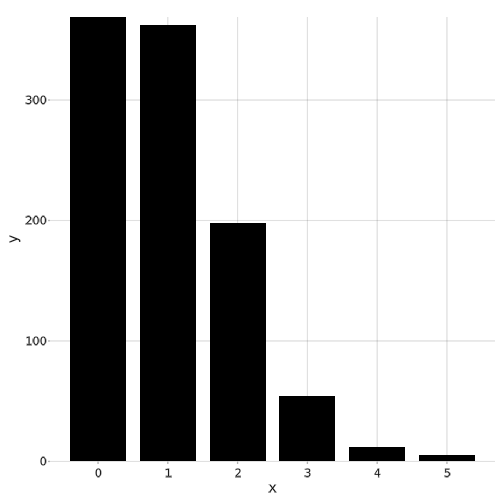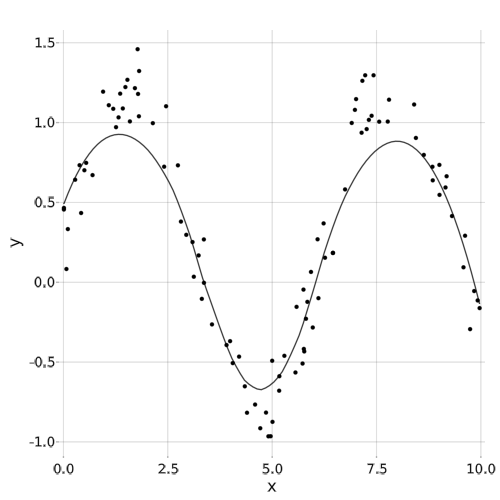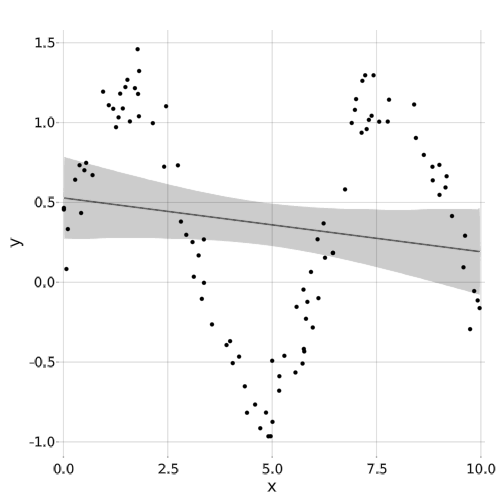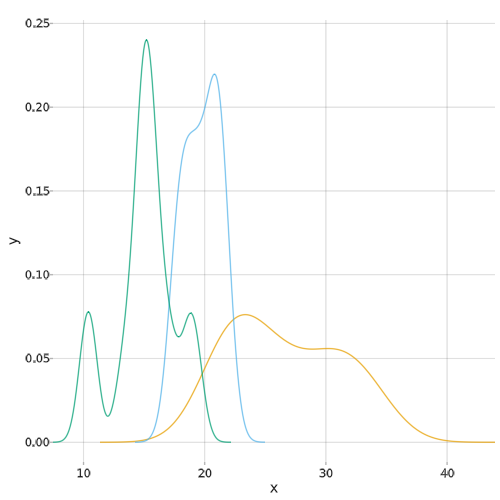
using StatsMakie
using DataFrames, RDatasets # for data
using StatsMakie: smooth, linear
using Distributions

using AbstractPlotting


mtcars = dataset("datasets", "mtcars")    # load dataset of car statistics
iris = dataset("datasets", "iris")

disallowmissing!.([mtcars, iris])  # convert columns from Union{T, Missing} to T
# We can use this because the dataset has no missing values.

@substep

# kde

plot(
    density,           # the type of analysis
    Data(mtcars),
    :MPG,
    Group(color = :Cyl)
)

@substep

# histogram

plot(
    histogram,         # the type of analysis
    Data(mtcars),
    :MPG,
    Group(color = :Cyl)
)

@substep

# frequency analysis

d = rand(Poisson(), 1000)
plot(frequency, d)

@substep

xs = 10 .* rand(100)
ys = sin.(xs) .+ 0.5 .* rand.()
scatter(xs, ys)
plot!(smooth, xs, ys)

@substep

scatter(xs, ys)
plot!(linear, xs, ys)